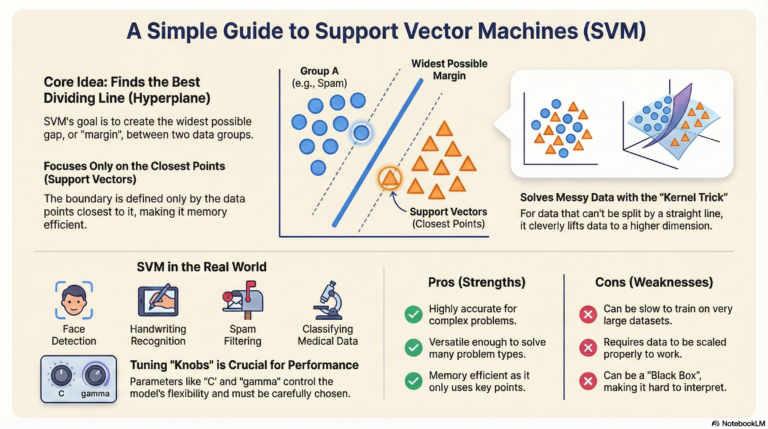
A classification model predicts categories or labels. For example:
- Email → Spam or Not Spam
- Image → Cat or Dog
- Patient → Has disease or Not
📊 Key Metrics for Classification
- Accuracy – How often is the model correct?
- Confusion Matrix – Summary of predictions vs actual values.
- Precision – How many predicted positives are truly positive?
- Recall (Sensitivity) – How many actual positives were identified correctly?
- F1 Score – Harmonic mean of precision and recall.
- ROC Curve and AUC Score – How well the model separates classes.
✅ Example: Evaluating a Classification Model in Python
Let’s use Scikit-learn to demonstrate.
Step 1: Load Sample Dataset
from sklearn.datasets import load_iris
from sklearn.model_selection import train_test_split
from sklearn.ensemble import RandomForestClassifier
from sklearn.metrics import accuracy_score, confusion_matrix, classification_report, roc_auc_score

# Load dataset
iris = load_iris()
X = iris.data
y = iris.target

# For binary classification, use only two classes
X = X[y != 2]
y = y[y != 2]

# Split data
X_train, X_test, y_train, y_test = train_test_split(X, y, test_size=0.3, random_state=42)
Step 2: Train the Classifier
model = RandomForestClassifier()
model.fit(X_train, y_train)
y_pred = model.predict(X_test)
Step 3: Evaluate the Model
1. Accuracy
print("Accuracy:", accuracy_score(y_test, y_pred))2. Confusion Matrix
print("Confusion Matrix:\n", confusion_matrix(y_test, y_pred))3. Precision, Recall, F1-Score
print("Classification Report:\n", classification_report(y_test, y_pred))📌 Output Example Explained
Sample Confusion Matrix (Binary):
[[13 1]
[ 0 16]]- 13 → True Negative (correctly predicted 0)
- 16 → True Positive (correctly predicted 1)
- 1 → False Positive (predicted 1 but was actually 0)
- 0 → False Negative (predicted 0 but was actually 1)
Sample Metrics:
Accuracy: 0.96
Precision: 0.94
Recall: 1.00
F1-Score: 0.97
📉 ROC Curve and AUC (Optional for binary only)
y_proba = model.predict_proba(X_test)[:, 1]
auc = roc_auc_score(y_test, y_proba)
print("AUC Score:", auc)
🎓 Summary Table (Quick Guide)
| Metric | Tells You | Ideal Value |
|---|---|---|
| Accuracy | Overall correct predictions | High |
| Precision | Correctness among predicted positives | High |
| Recall | Ability to catch all actual positives | High |
| F1 Score | Balance between Precision and Recall | High |
| AUC Score | Separation between classes | Close to 1 |


