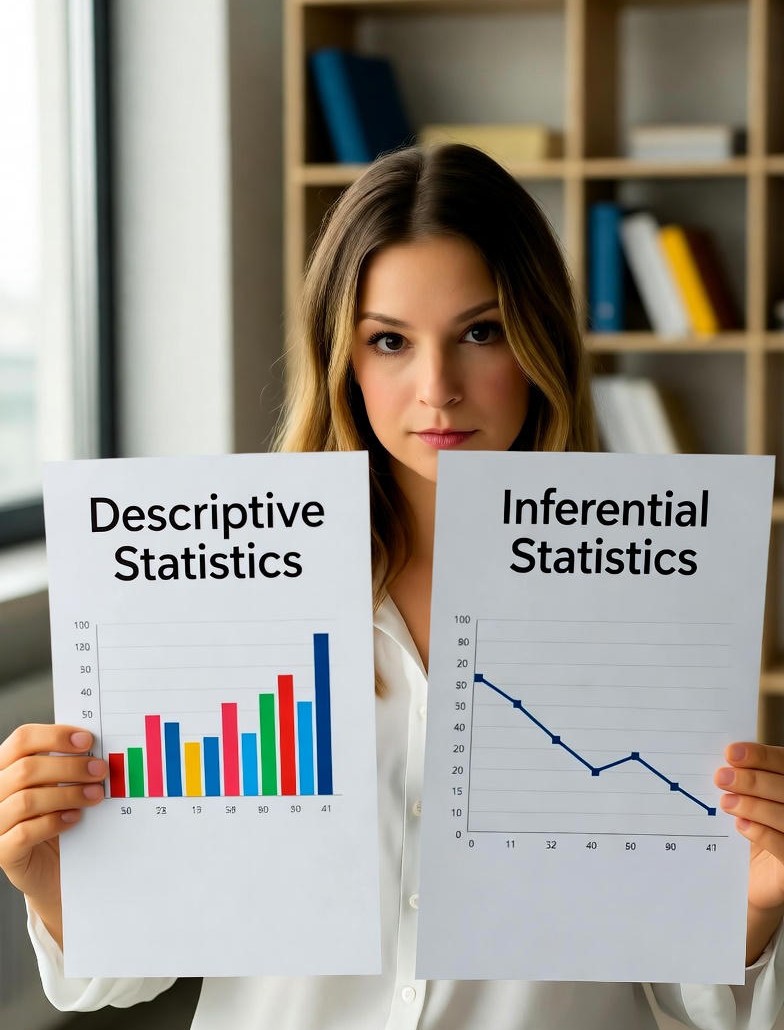
Difference Between Descriptive and Inferential Statistics
Meta Description:
Learn the key difference between descriptive and inferential statistics with easy examples, definitions, and comparison tables. Understand how both help summarize and analyze data effectively.
🧠 Introduction
Statistics is the foundation of data science and analytics. It helps us collect, analyze, and interpret data to make informed decisions.
Broadly, statistics is divided into two main branches:
👉 Descriptive Statistics and Inferential Statistics.
While both deal with data, they serve very different purposes.
Let’s understand each in detail with examples and comparisons.
📘 1. Descriptive Statistics
🧾 Definition
Descriptive statistics is about organizing, summarizing, and presenting data in a meaningful way.
It focuses on what the data shows, not on drawing conclusions beyond it.
🎯 Goal
To describe and summarize the basic features of a dataset.
⚙️ Common Tools and Measures
- Central Tendency: Mean, Median, Mode
- Dispersion: Range, Variance, Standard Deviation
- Visualization: Bar charts, Histograms, Pie charts, Box plots
📊 Example
Suppose you collected the heights of 100 students in a university:
- You calculate the average height = 165 cm
- You create a histogram to show height distribution
This is descriptive, because you’re only summarizing and describing the data you have (the sample).
💡 Output Example (Python Code)
import numpy as np
import matplotlib.pyplot as plt

# Heights of 100 students (sample data)
heights = np.random.normal(165, 10, 100)

print("Mean height:", np.mean(heights))
print("Median height:", np.median(heights))
print("Standard Deviation:", np.std(heights))

# Visualization
plt.hist(heights, bins=10, color='skyblue', edgecolor='black')
plt.title("Distribution of Students' Heights")
plt.xlabel("Height (cm)")
plt.ylabel("Frequency")
plt.show()
Sample Output:
Mean height: 164.82
Median height: 165.34
Standard Deviation: 9.85
📈 The histogram shows how students’ heights are spread around the average.
📗 2. Inferential Statistics
🧾 Definition
Inferential statistics uses data from a sample to make predictions or generalizations about a population.
It helps us go beyond the data we have, using probability theory to draw conclusions.
🎯 Goal
To infer or predict something about the entire population using sample data.
⚙️ Common Tools and Techniques
- Hypothesis Testing (t-test, chi-square, ANOVA)
- Confidence Intervals
- Regression Analysis
- Correlation Analysis
📊 Example
You collected data for 100 students’ heights (sample) from a university with 10,000 students (population).
- The sample mean = 165 cm
- You use inferential statistics to estimate the population mean
with a 95% confidence interval.
That estimate (say, 163 cm – 167 cm) is inferential, because it extends findings from your sample to the entire university population.
💡 Output Example (Python Code)
import numpy as np
import scipy.stats as stats

# Sample data
heights = np.random.normal(165, 10, 100)

# Sample mean and standard error
mean = np.mean(heights)
std_err = stats.sem(heights)

# 95% Confidence Interval
confidence_interval = stats.t.interval(0.95, len(heights)-1, loc=mean, scale=std_err)

print("Sample Mean:", round(mean, 2))
print("95% Confidence Interval:", confidence_interval)
Sample Output:
Sample Mean: 165.08
95% Confidence Interval: (163.12, 167.04)
✅ Interpretation:
We are 95% confident that the true average height of all students in the university lies between 163.12 cm and 167.04 cm.
🧾 Summary Table: Descriptive vs Inferential Statistics
| Feature | Descriptive Statistics | Inferential Statistics |
|---|---|---|
| Definition | Summarizes and describes data | Makes predictions or inferences about population |
| Data Used | Entire dataset (sample or population) | Sample data to infer about population |
| Goal | Present information clearly | Draw conclusions and make decisions |
| Examples | Mean, Median, Mode, Graphs | Hypothesis Testing, Confidence Intervals |
| Output | Charts, tables, and summaries | Estimates, predictions, probabilities |
| Dependence on Probability | Not dependent | Strongly depends on probability theory |
| When Used | First step in data analysis | Next step — after description, for decision-making |
🧠 Simple Analogy
| Everyday Example | Type |
|---|---|
| Reporting the average marks of 50 students in a class | Descriptive |
| Predicting the average marks of all 500 students in the school using that class sample | Inferential |
💬 Final Summary
| Aspect | Descriptive | Inferential |
|---|---|---|
| What it does | Describes “what is” | Predicts “what could be” |
| Focus | Data summary | Drawing conclusions |
| Use Case | Data exploration, visualization | Decision-making, forecasting |
🏁 Conclusion
In short:
- Descriptive Statistics helps you summarize data.
- Inferential Statistics helps you make predictions or decisions from it.
Both are essential for any data analysis pipeline — first, describe your data, then use inference to draw deeper insights.